Ruijie JaCS supports viewing the network topology of some devices in the project. The topology interface displays the topology of the downlink devices of an online device in the current project. It enables the diagnosis of all online devices within the project and generates comprehensive diagnostic reports.
Note: Ruijie JaCS currently only supports displaying the topology of the following models: RG-EG5210-JP, RG-HS2310-16GH2GT1XS, RG-MT3002 and RG-MU3064.
To view a topology of an online device:
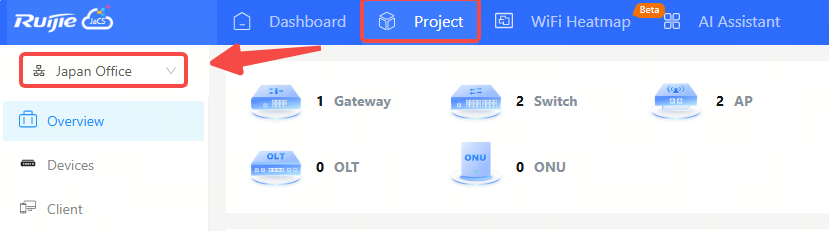
Step 1: Click Project, and the select the project where the device is located.
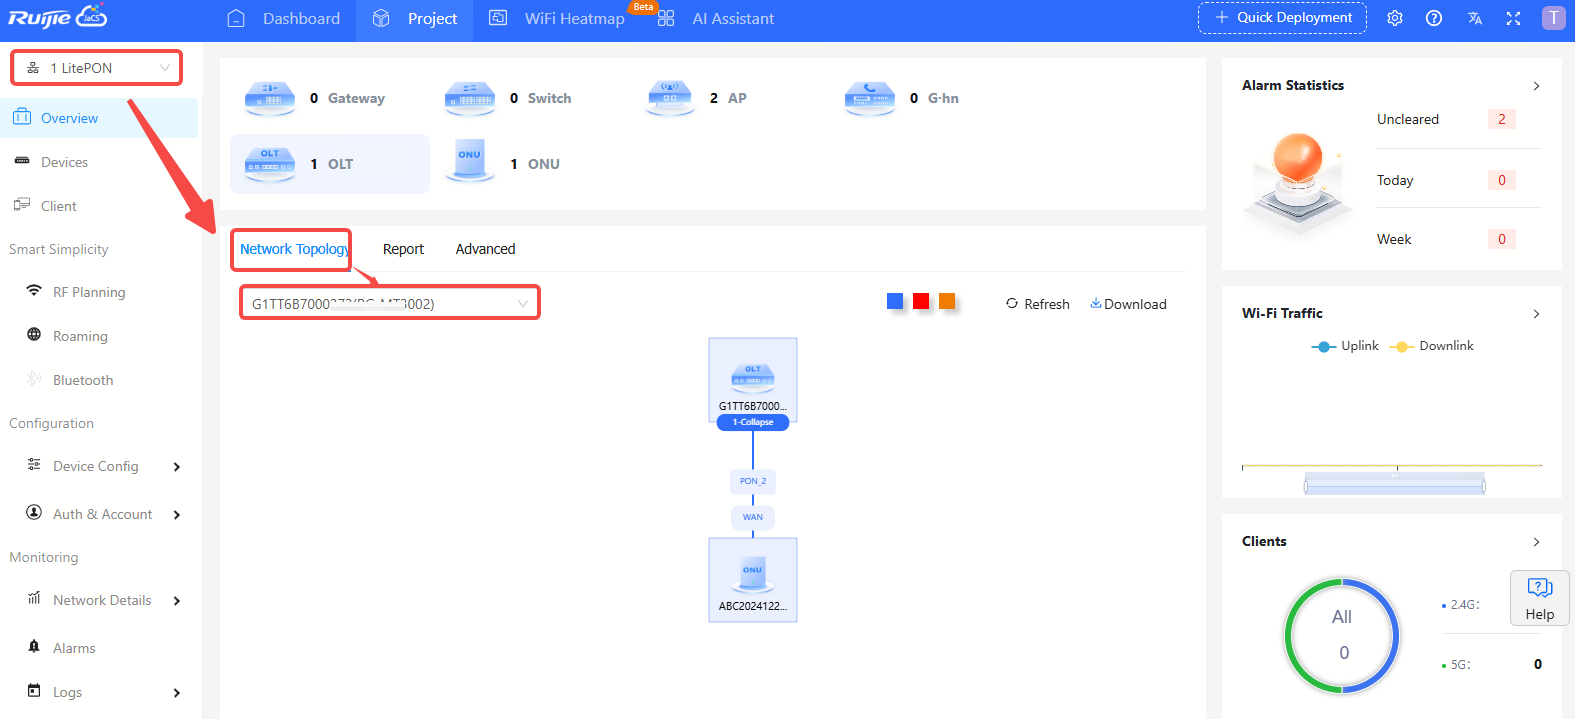
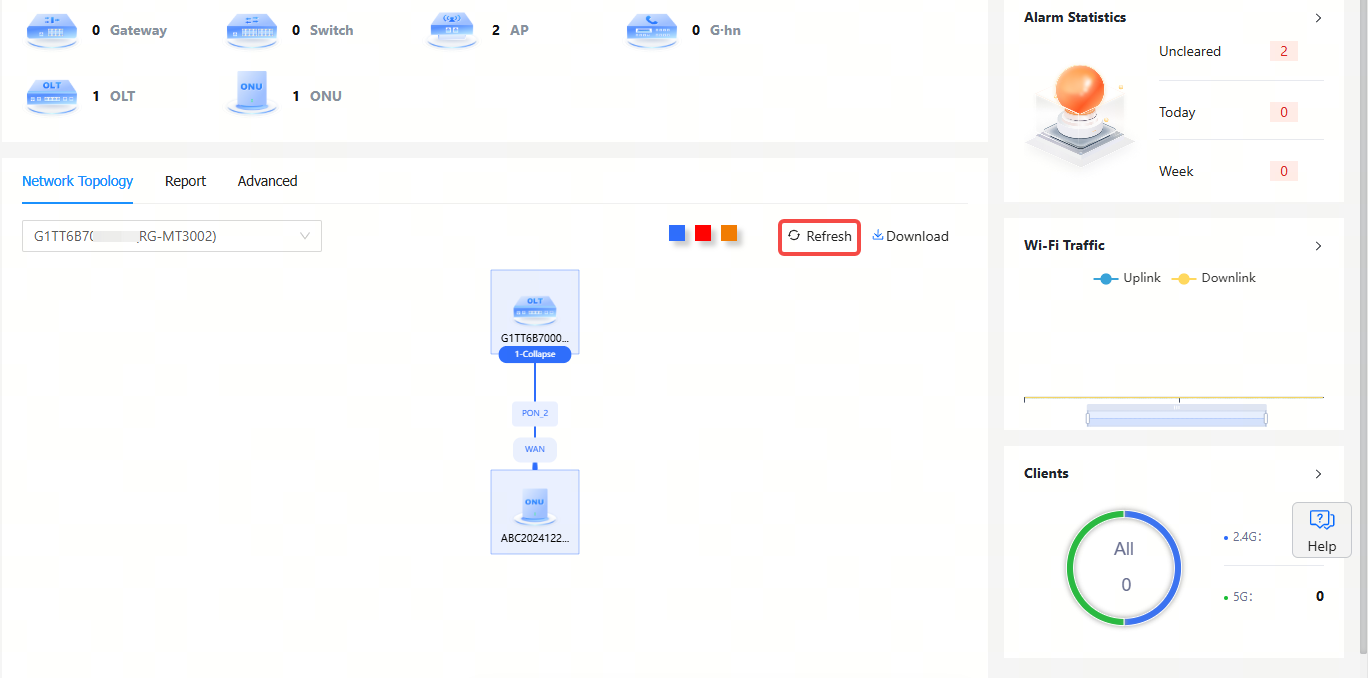
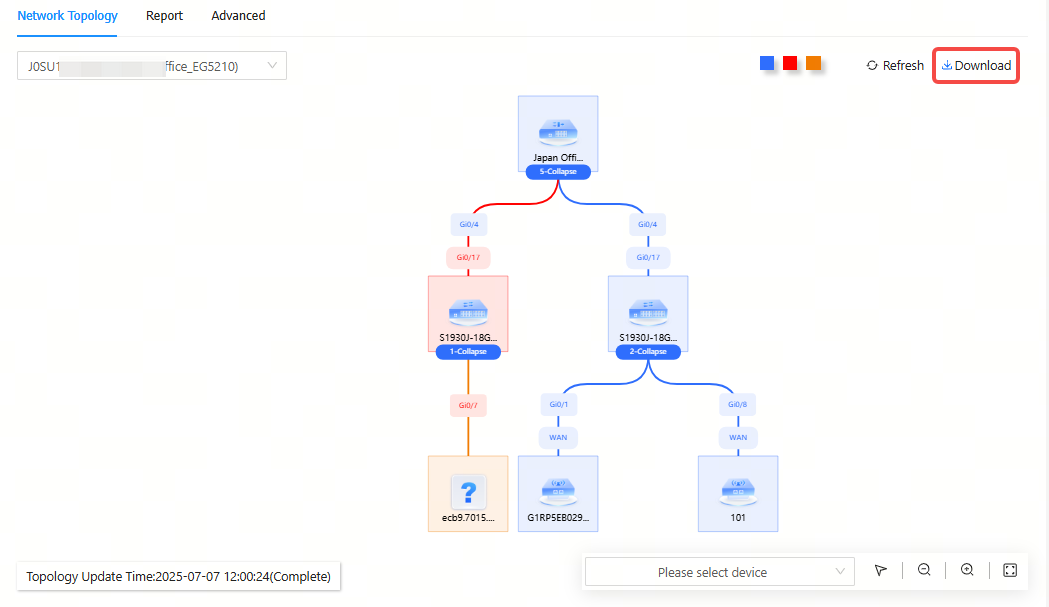
Step 2: Navigate to Overview > Topology to go to the topology interface. Select the device you want to view. After selecting, the topology of the device will be displayed below.
Different colors in the topology represent different link states.
(1) Green means the device is functioning normally.
(2) Red indicates the device is offline or disconnected from the switch.
(3) Orange means the device is not connected to the cloud or belongs to another account.
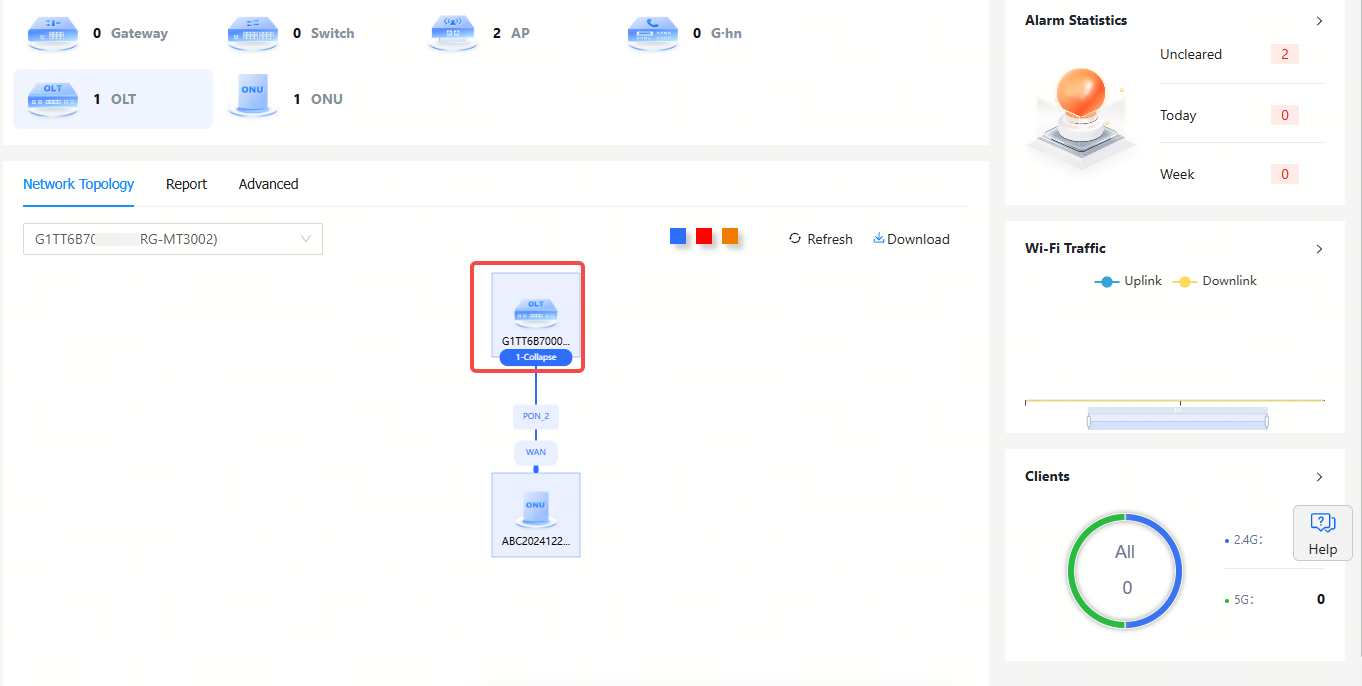
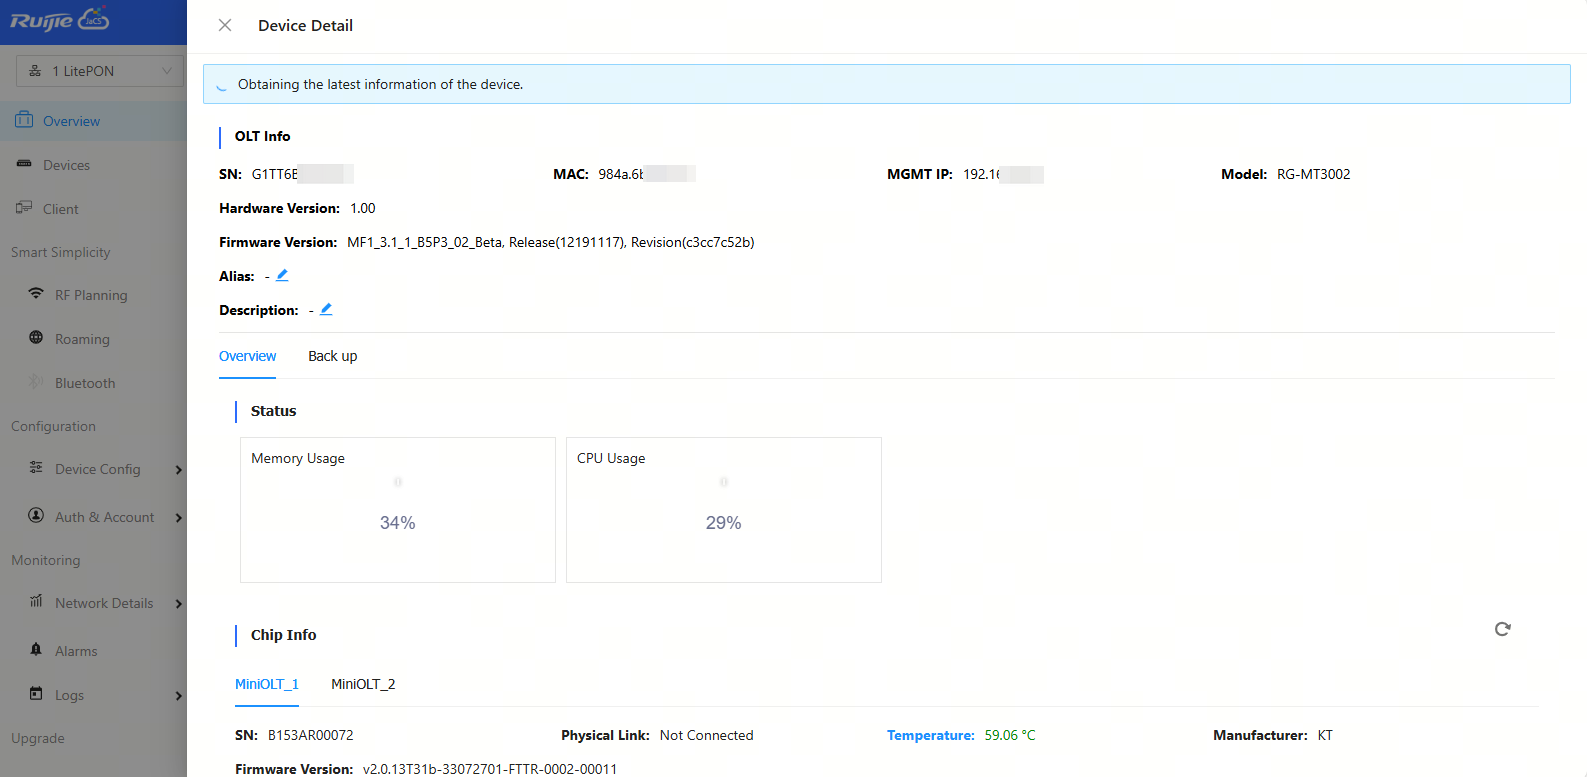
Click a device image, you can view its detailed information.
Click Refresh to refresh the downlink topology of the device. The refresh interval should be greater than 10 minutes, otherwise a prompt will appear indicating frequent operations. The topology update is triggered when the switch is selected for the first time.
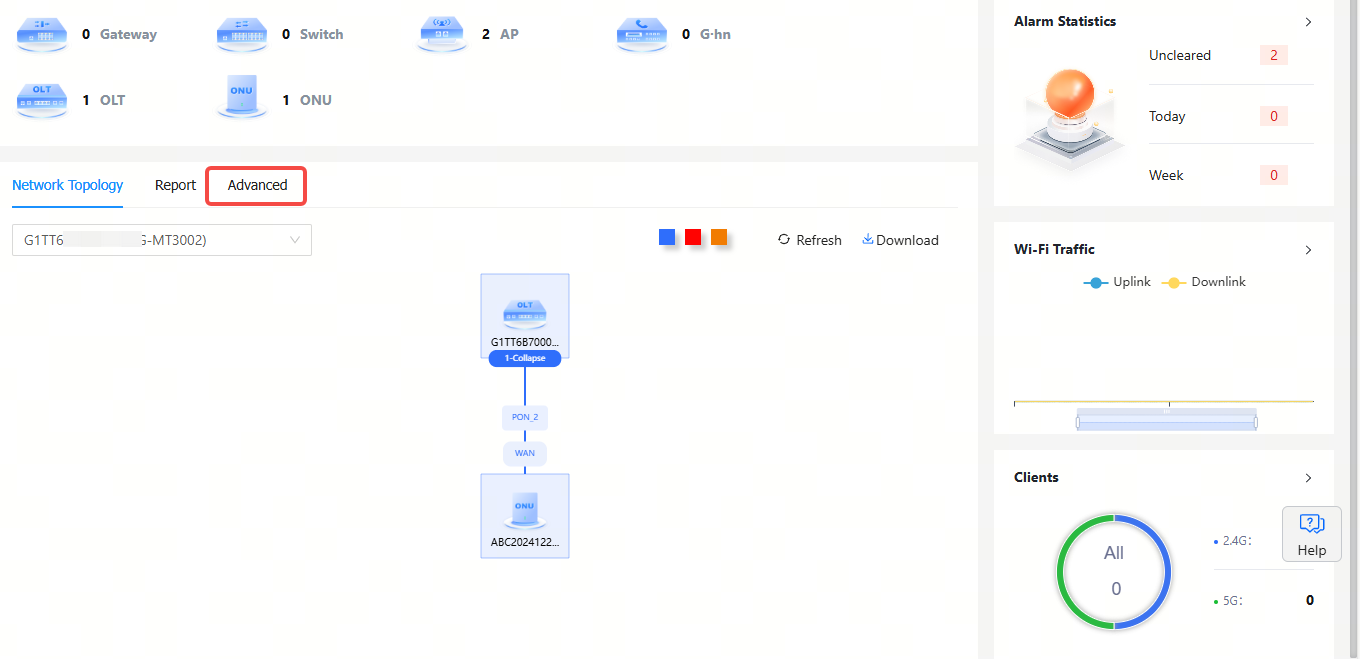
To refresh the topology regularly:
Step 1: Click Advance to go to the setting page.
Step 2: Enable the schedule refresh function.
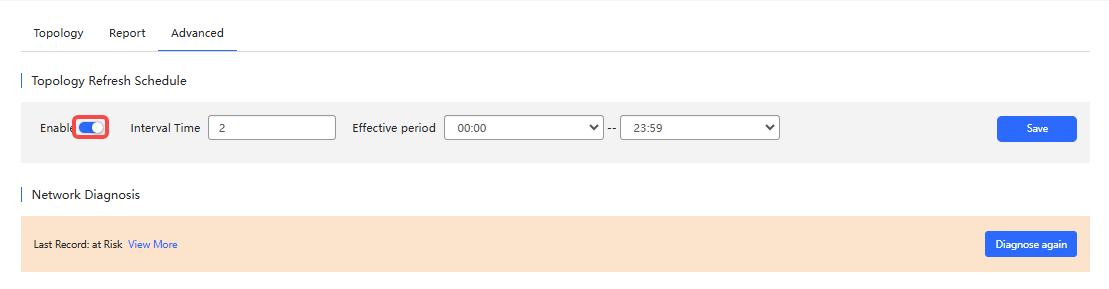
Step 3: Set the refresh interval and effective time period, and then click Save.
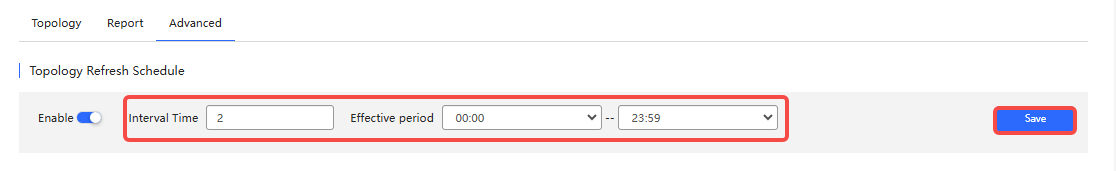
Note: The minimum interval time supported is 2 hours, and the maximum interval time supported is 23 hours.
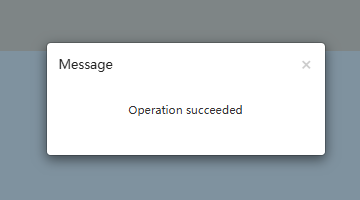
Step 4: After the "Operation succeeded" prompt appears, click X to close the prompt box and complete the operation.
Click a port icon in the topology, you can view its detailed information. The port information includes: port ID, port status, speed, upstream and downstream traffic, throughput, upstream and downstream packet rates, and port types.
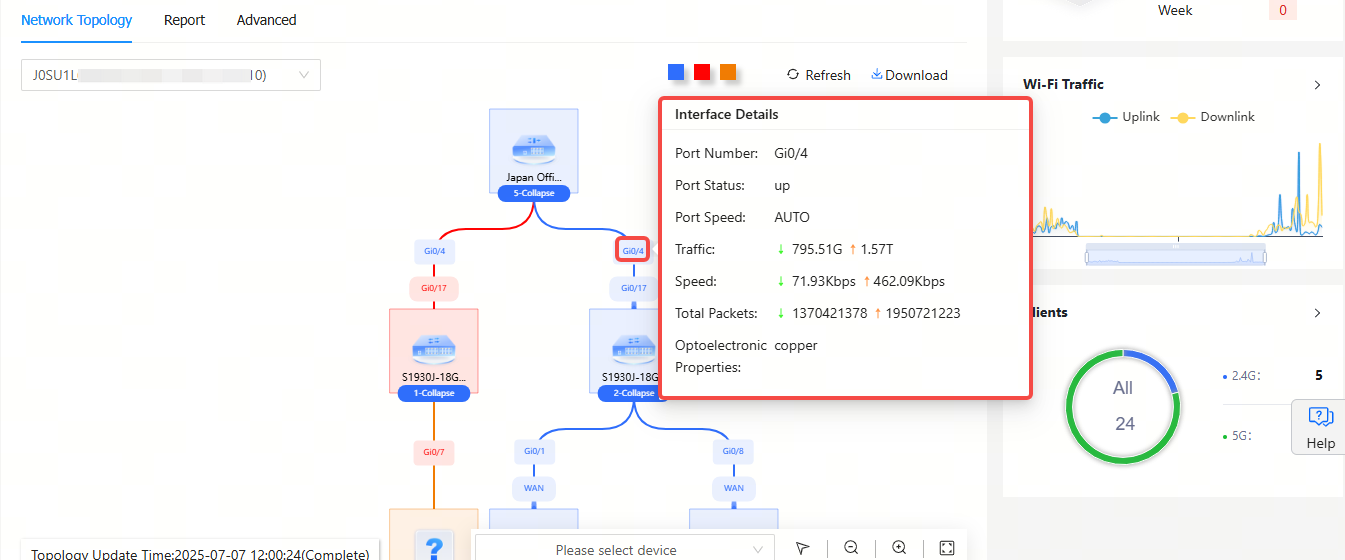
Note: RG-HS2310-16GH2GT1XS is connected to RG-HA3515-DG through the G.hn port via a telephone line. The G.hn port is displayed as Ghnx/x on the page. Clicking a G.hn port number will display the detailed information of the port. The speed displayed in the Speed item is the actual downlink speed. The speed of other devices is displayed as 100M/1000M.
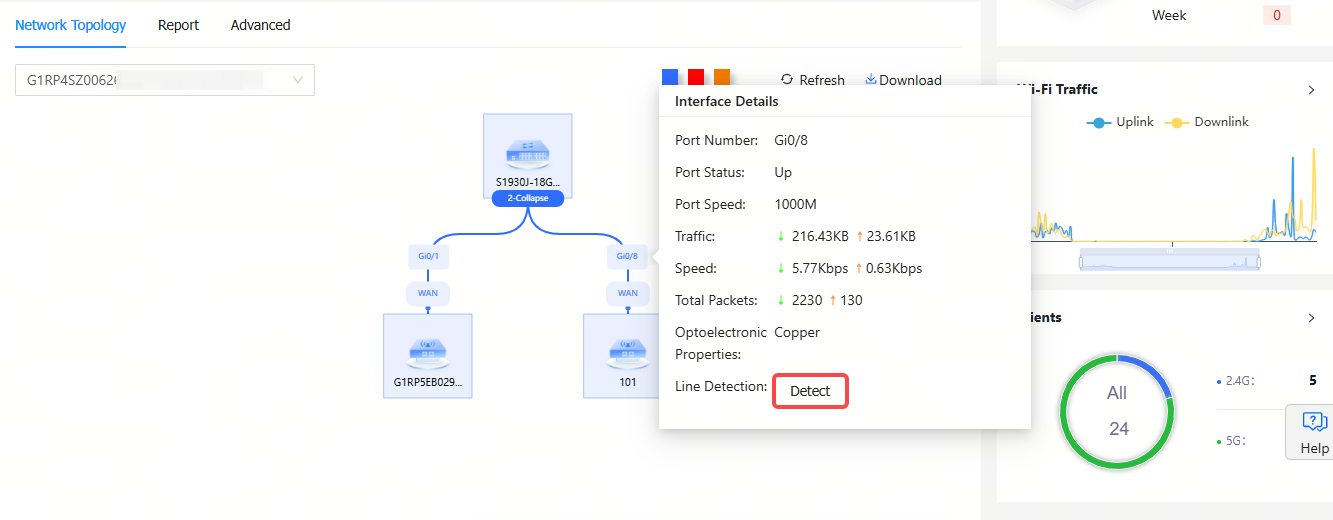
In the topology, hover the cursor over a port to view its detailed information. In the detailed information box, click Detect to initiate link detection. Do not perform any operations during the detection process. The possible outcomes are: link normal, link fault, or no link.
Note: The physical link detection function is not available for RG-EG5210-JP.
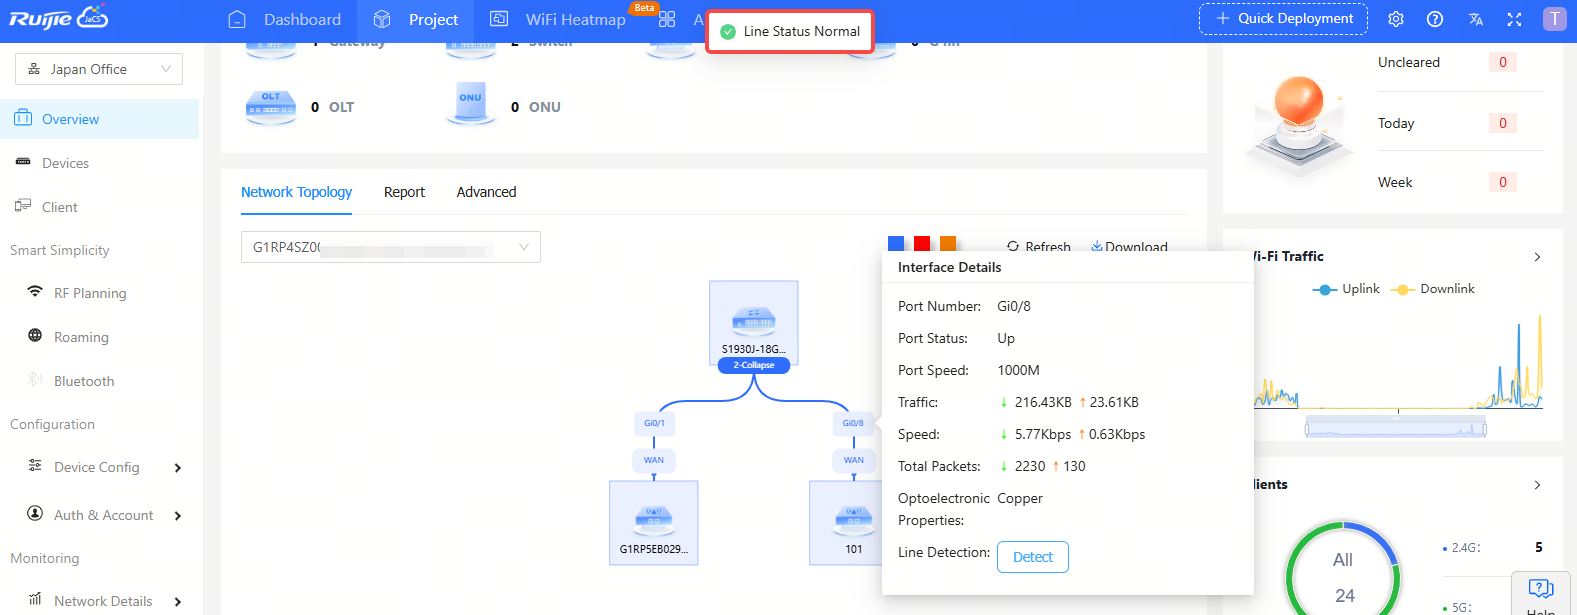
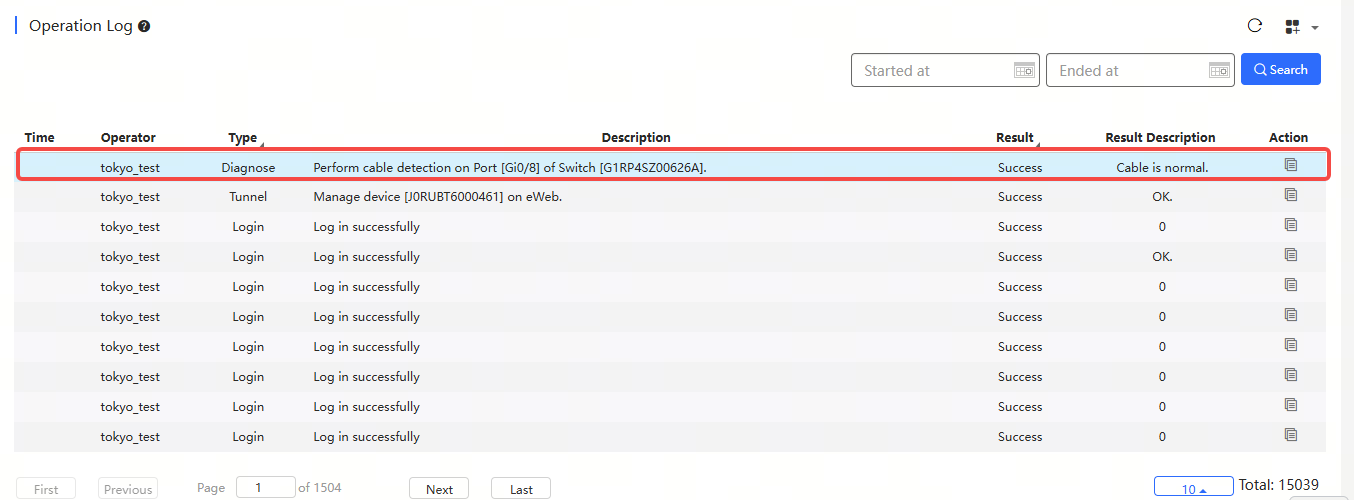
After the detection is completed, you can view the operation log in Operation Log interface.
Click Download to export the current topology diagram.
Follow the steps below to diagnose the network:
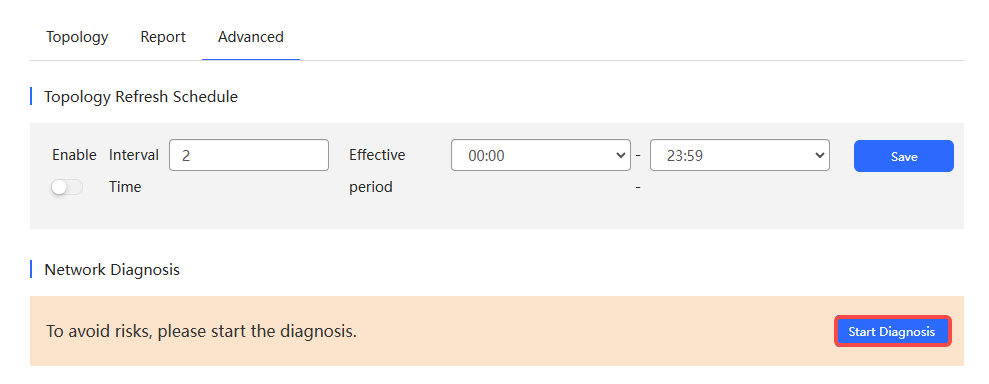
Step 1: Click Advanced to go to the setting page.
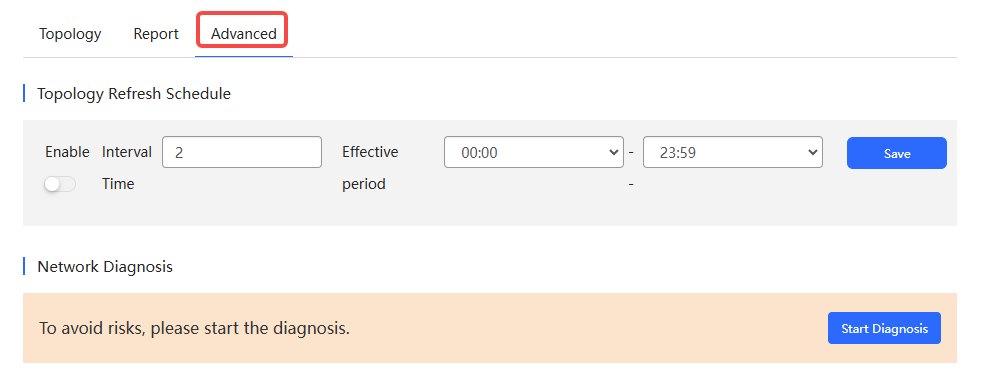
Step 2: Click Start Diagnosis to start diagnosis.
Step 3: Wait for diagnosis results.

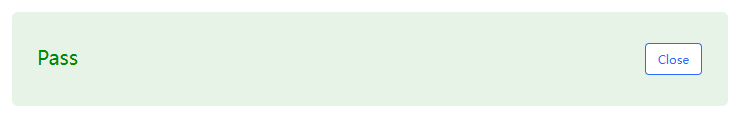
If no risk is detected, the following interface will be displayed:
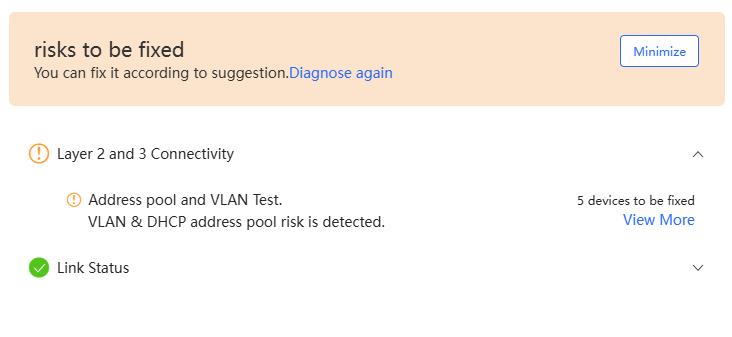
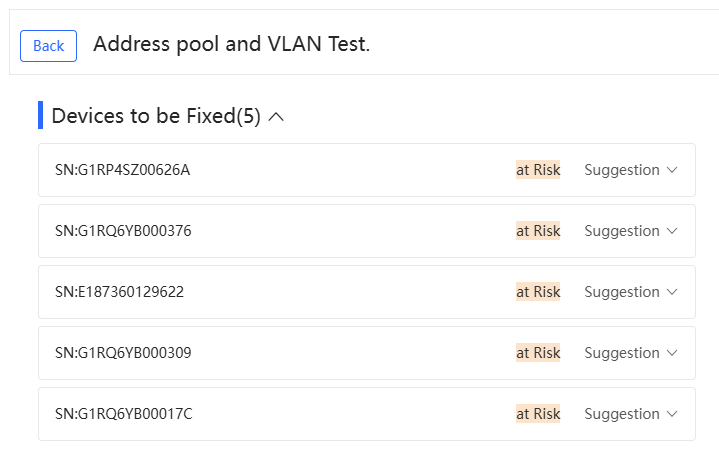
If a risk is detected, the following interface will be displayed. Click View More to view the details and the recommended handling methods.
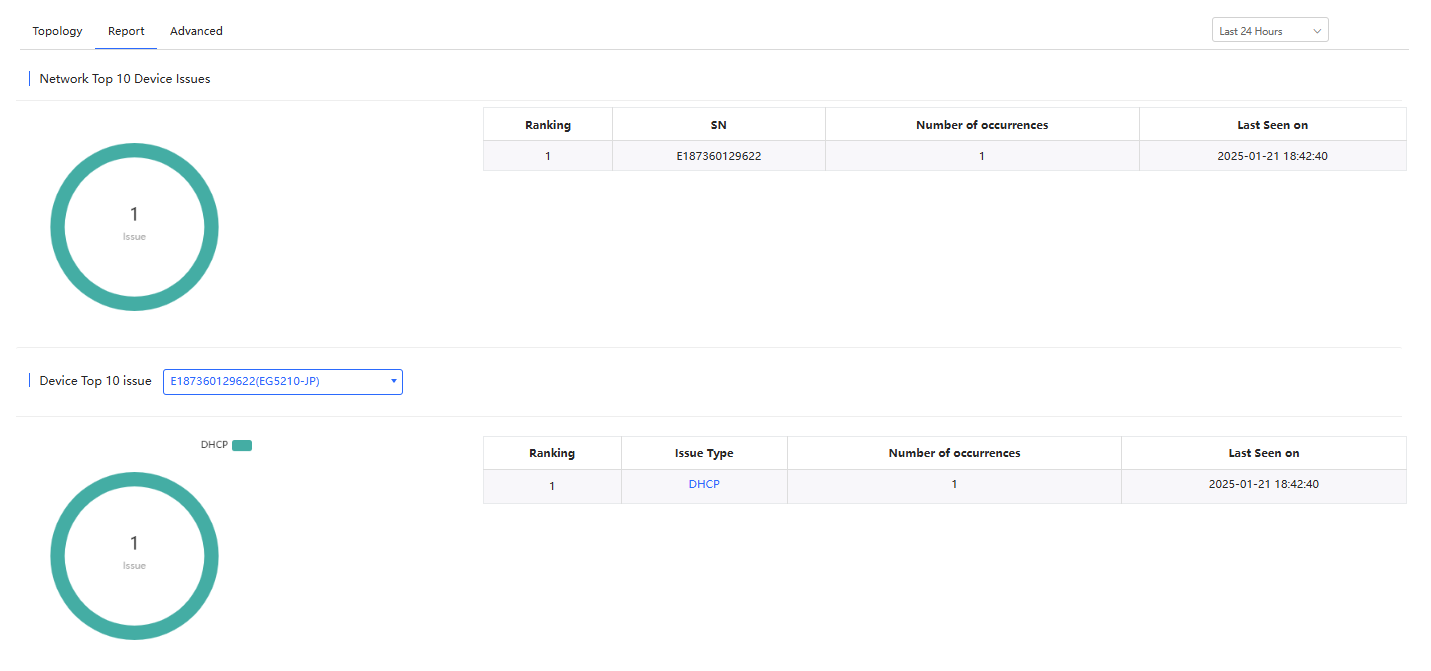
(1) Network Top 10 Device Issues: This chart displays the top 10 faulty devices and the last time when the fault occurs in a network.
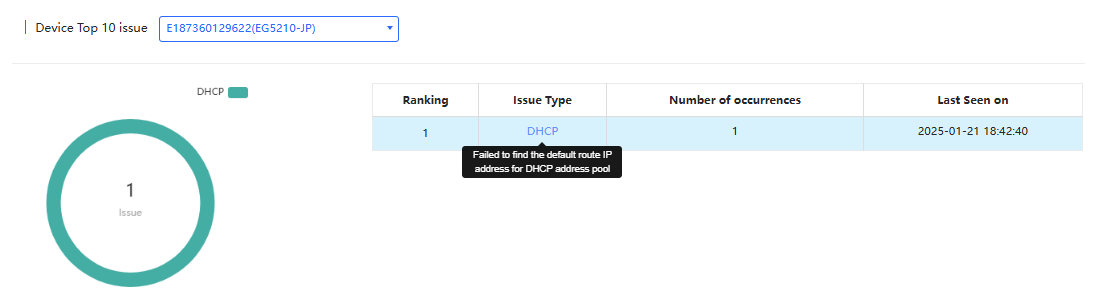
(2) Device Top 10 issue: This chart displays the top 10 failure types occurring among devices and the last time when the fault occurs. You can hover the cursor over a failure to check the details.
全部评论